2017 Consumer Expenditure Study Supermarket Sales Charts


Methodology
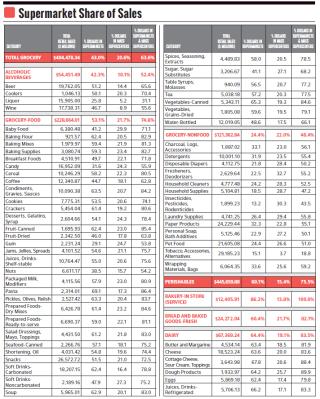
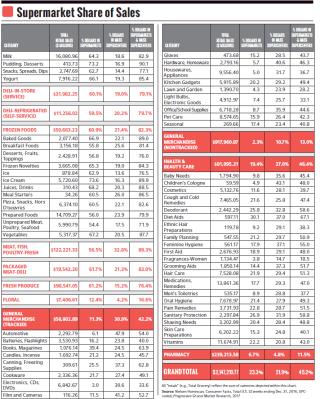
Progressive Grocer’s 70th Annual Consumer Expenditures Study (CES) is based on data collected by Schaumburg, Ill.-based Nielsen for UPC-coded products, as well as PG sales estimates for nontracked categories, including perishables and general merchandise.
Data for total retail sales and share of market for supermarkets and mass supercenters is drawn from Nielsen’s “Homescan Consumer Facts 2016” report. The Nielsen Homescan Panel is made up of more than 100,000 U.S. households. This geographically and demographically representative longitudinal panel tracks UPC and perishable products from all retail outlets with mobile apps and handheld scanners.
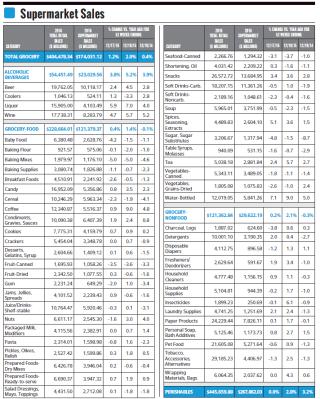
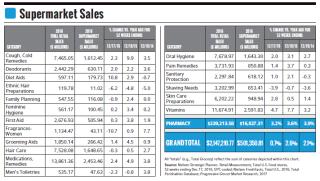
All “totals” and “subtotals” (e.g,. Total Grocery, Perishables, etc.) reflect the sum of specific categories as depicted in this study. This is by directive of PG and will differ from Nielsen’s view of each data universe. Some totals may not justify due to rounding or suppression of sales detail. Categories with sales of less than $10 million are subject to omission.
This report spotlights sales trends by percent of buyers in retail channels, channel share of sales and total supermarket sales.
Sales for U.S. supermarkets for 2016, shown in millions of dollars, are based on data from Nielsen’s Strategic Planner database of UPC-scanned items, as well as on PG estimates for categories for which Nielsen doesn’t collect scan data. Select fresh and perishable data is provided by Nielsen FreshFacts.
Top brand data for category spotlights is provided by IRI, a Chicago-based market research firm. This data encompasses total U.S. food sales. Additional sources for PG’s analysis are cited in the text.
An expanded version of PG’s 70th Annual Consumer Expenditures Study, which includes in-depth supermarket category sales results, will be available at progressivegrocer.com.


