Annual Report: Supermarket Sales Drivers Revealed
(Editors' note: This is part four of a five-part series.)
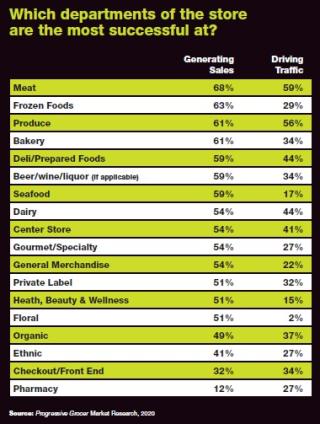
When asked which departments of the store were most successful at generating sales, respondents to Progressive Grocer’s 2020 Annual Report survey once more looked to meat, with a whopping 68% singling it out as a top-selling section, the same as in 2019.
READ THE REST OF THE REPORT
Other huge sales magnets, according to the survey, were frozen foods, at 63%, way up from 22% last year; produce and fresh bakery, both at 61%, with produce having slid from 68% and bakery having risen from 33%; beer/wine/liquor (where applicable), deli/prepared foods, and seafood, all, at 59%, higher than last year; and center store, general merchandise and gourmet/specialty, all, at 54%, showing considerable increases over 2019. Floral; health, beauty and wellness; and private label were all pegged as big sales generators by 51% of respondents, again revealing solid increases, while organics were noted by 49%, quite a jump from last year’s 21%.
Less successful at driving sales were ethnic foods, at 41% (a big improvement from 5% in 2019, however); checkout lanes/front end, at 32% (up from 12%); and pharmacy, at a paltry 12% (down from 17%).

These mostly rising percentages indicate that more departments than ever are adept at generating sales, which means better business for stores, and the grocery industry, on the whole.
When it came to driving traffic, meat again was No. 1, chosen by 59% of survey respondents, although down from 63% last year, closely followed by produce, at 56%, a slight decline from 2019’s 58%. By contrast, the next-highest departments, dairy and deli/prepared foods, trailed at 44% each, with deli/prepared foods slightly up from 40% last year and dairy showing a marked increase from 27% in 2019.
Meanwhile, center store scored with 41% of respondents (up from 30%); organic products garnered 37% (up from 18%); beer/wine/liquor (where applicable), fresh bakery and checkout lanes/front end were all selected by 34%, with the last two seeing considerable rises and the first a dip from 38%; and private label made the grade with 32%, versus last year’s 12%. The departments considered less successful at driving traffic were frozen foods (29%, up from 8%); ethnic foods, gourmet/specialty and pharmacy (all 27%, up from 3%, 5% and 12% in 2019, respectively) general merchandise (22%, up from 5%); seafood (17%, up from 12%); health, beauty and wellness (15%, up from 7%); and floral (a mere 2%, down from last year’s 3%).

Since some of these departments, such as seafood, ranked high as sales generators, however, the issue is to make sure that customers are directed to those somewhat overlooked parts of the store, where, once shoppers see what’s available, they’re likely to make substantial purchases. Signage and displays outside of those departments reminding consumers to drop by to see what else is offered there could help in this regard.
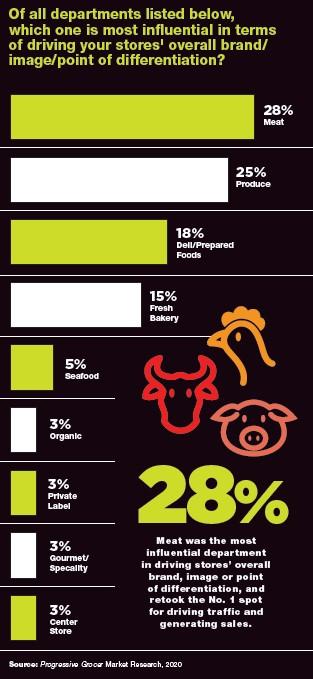
As for the departments deemed the most influential in driving their stores’ overall brand/image/point of differentiation, meat was unsurprisingly the winner here as well, with 28% of Annual Report respondents selecting it, a decline from 33% last year. Next was produce, at 25% (up from 23%); deli/prepared foods, at 18% (up from 12%); and fresh bakery, at 15% (up from 3%) — these results affirming the ongoing importance of fresh perimeter departments to a store’s identity.
Taking up the rear by a wide margin were seafood (at 5%, up from 2%, however) and organics, private label, gourmet/specialty and center store (all 3%, compared with 2%, 7%, 5% and 5%, respectively, last year ). As with the traffic drivers, these results suggest that seafood, which is, after all, also a fresh department, needs to develop a presence separate from meat to register with consumers as a paramount reason to shop a store regularly.


