How High Can Inflation Go?

Inflation data is coming in from June and it points to a hot pricing start to the summer. In fact, the numbers are even higher than anticipated.
According to the new Consumer Price Index (CPI) information released by the U.S. Bureau of Labor Statistics (BLS), the 1.3% inflation rate in June topped the previous month’s figure that was a 40-year high. The CPI for all items is now up 9.1% for the past 12 months.
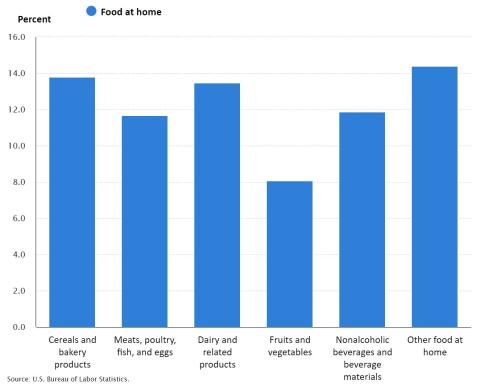
Once again, food was a major contributor to inflation gains in June. The CPI for food at home rose 1% last month and is 12.2% higher than this time last year. That yearly pace was the highest since April 1979.
Within the food-at-home sector, five of the six major grocery indexes increased last month. BLS data shows sizable increases in the CPI for butter, sugar and sweets. The index for cereals and bakery products climbed 2.1% in June, while dairy and related products were up 1.7% for the period.
In a bit of a relief for what has been a hard-hit segment, the CPI for meat, poultry, fish and eggs fell 0.4%. Indexes for beef and pork were down after a series of increases over the past several months.
In comparison, BLS data revealed that the index for food away from home went up 0.9% in June. Since June 2021, the index for that sector has edged 7.7% higher.
Another fresh data set from tech company Numerator likewise points to inflationary pressures roiling the marketplace. That company’s latest inflation insights and shopping behavior index confirm still-rising grocery prices: Numerator’s data shows that grocery inflation reached a new high of 15.1% on a year-over-year basis and has more than doubled since the beginning of 2022 when the yearly rate was 7.4%.
Numerator found that the most affected categories include frozen meat (+28%), chips (+26%), poultry (+25%), water (+22%) and milk/milk substitutes (+17%). Beverages bore a brunt of price hikes in the most recent report, with five beverage categories among the top 10 for inflation.
Those looking for more positive news can find it in Numerator’s data showing that the rate of inflation for household items is down 5.9% compared to mid-June, even though those products are still up 11.3% versus a year ago.
In addition to providing product and category specifics, Numerator’s research tracked the effect of soaring prices on consumer sentiment and behavior. According to the latest report, although overall spending remains elevated, there are signs of softening demand, with units per trip declining 13% for a 2022 low. Optimism is also flagging, with less than half (47.4%) of consumers rating their financial situation as “good” or “very good,” down from 56.2% of consumers in July 2021.
High prices are impacting some groups more than other. Numerator determined that Hispanic/Latino consumers are facing the highest inflation rates for groceries at 16.1% and that Gen Z is the most affected generation, with higher increases than those in the Gen X, Baby Boomer and Millennial age groups.
“As the cost of everyday goods continues to rise, consumers are shopping around to find value,” said Eric Belcher, Numerator’s CEO. “Many of these shifts, including high-income households trading down to dollar stores, are unexpected.”


